
Configuration front-end
There is always a need to develop system specific software tools that would complement a CPS testbed by providing visual information overlay and appreciation to the user about the activity in the network, thereby abstracting implementation specific details. Similarly, at the heart of our proposed programmable testbed implementing an automated Multi-hop Wireless NCS (MCN), there is also a GUI-driven software tool-flow that facilitates visualization, scheduling, and analysis of MCN under various external non-idealities. The software application has been developed in Qt framework to avail its cross platform compatibility under the GNU Lesser General Public License v.3 (LGPL). Binaries have been successfully generated and tested on the 64 bit Windows 7, Windows 10, and Linux (Ubuntu 16.04) platforms with minimal modification to the source.
The feature that makes our testbed unique compared to existing ones is its easy-to-use GUI-based interface. Based on this GUI, the following tasks can be controlled: 1) Automatized CPS configuration, 2) generation of firmware for each node, 3) wireless deployment of the firmware onto each node, 4) real-time execution and orchestration of the CPS, and 5) data aggregation and visualization. In other words, a user can specify its configuration in a simple fashion, and our tool will generate a CPS testbed realizing these specifications on-the-fly. This allows for studying CPS testbed configurations that are actually different CPS, while using one physical setup. With our approach, manually integrating plants, controllers and the communication network is no longer required.
The core of our developed testbed is this software tool, which runs on a PC that is wirelessly connected to the CPS setup. Based on a CPS specification, which is given in terms of network parameters, control parameters and plant dynamics, our tool automatically generates and deploys the firmware of the individual nodes in the network. It thereby configures the nodes, as well as their network interfaces. The graphical user interface (GUI) of the tool with functionalities can be broadly categorized in two modes: 1) Configuration and Firmware Generation and 2) Data Analysis.
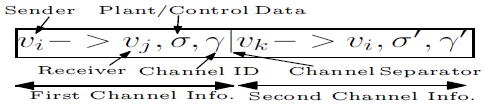
The GUI-based front-end is used for specifying the CPS that is to be realized. The software tool provides an interface using which the user can enter the input specifications of the system, namely, the network topology, the network schedule, the reference values of the plant output, and fault characterizations. As in the 'Configuration front-end' figure, The Region-A shows the basic user input window pertaining to the schedule length, number of nodes, and the type of fault distributions to be programmed in the nodes. Region-B is used to populate the network schedule for the control loops. The format for entering scheduling information within a slot is shown in the given figure, where schedule information for multiple channels are entered, tokenized using channel separator. Additional configuration information such as packet drop probabilities for individual nodes, reference values of the plants etc, are entered through Region-C.
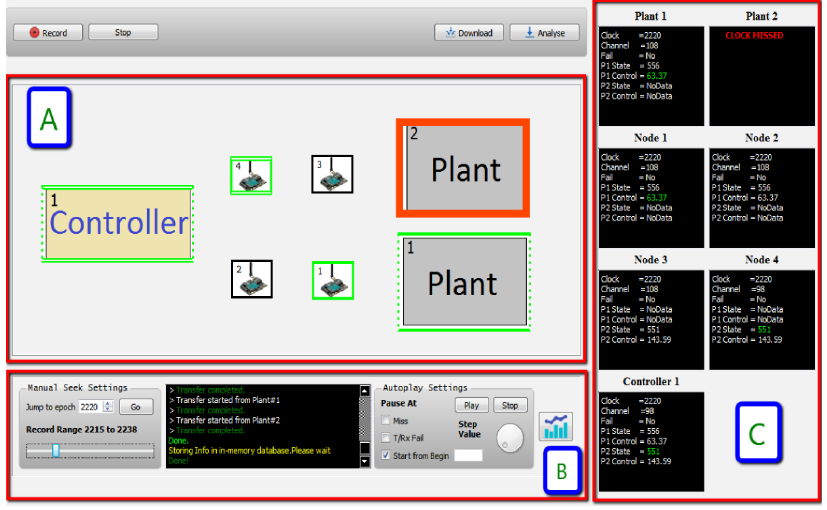
After an experiment of the CPS has been carried out, the data is transmitted wirelessly to the PC and can then be analyzed using our software tool. Our tool orchestrates data collection and aggregation and provides functionality to visualize and analyze the CPS behavior. The front-end for data analysis is depicted in Analysis Front-end picture. The upper Part A visualizes the CPS. Suitable icons represent plants, intermediate nodes and controllers. On the left of the lower Part B, the user can select the point in time of the experiment to be examined. In the middle of Part B, a console depicts various messages. On the right of Part B, the Autoplay Settings allow for automatically advancing the point in time under consideration. This enables a record and playback - style of operation. The right Part C of the figure shows the internal state of each node at the point in time under consideration.